A growing proportion of web traffic is API traffic with many sources now showing API traffic being more than 50% of total web traffic. Cloudflare has prior reported that 54% of the traffic on the global Cloudflare network is API traffic. Cloudflare API Shield provides many capabilities for API visibility, security, abuse protection, and management. Cloudflare API Shield already had many capabilities including API discovery, API analytics, positive security model with mTLS and schema validation, intelligent custom rate limiting, volumetric abuse protection, and sensitive data protection. Now Cloudflare has recently added the capability to add and manage API endpoints and gain visibility to API performance and errors while also providing anomaly detection alerts.
API endpoints can now be saved from those learned by Cloudflare dynamically or can be manually added. You can see all the dynamically discovered API endpoints under Security->API Shield->Discovery. From here, the desired endpoint(s) can be saved by clicking the Save Endpoint link.
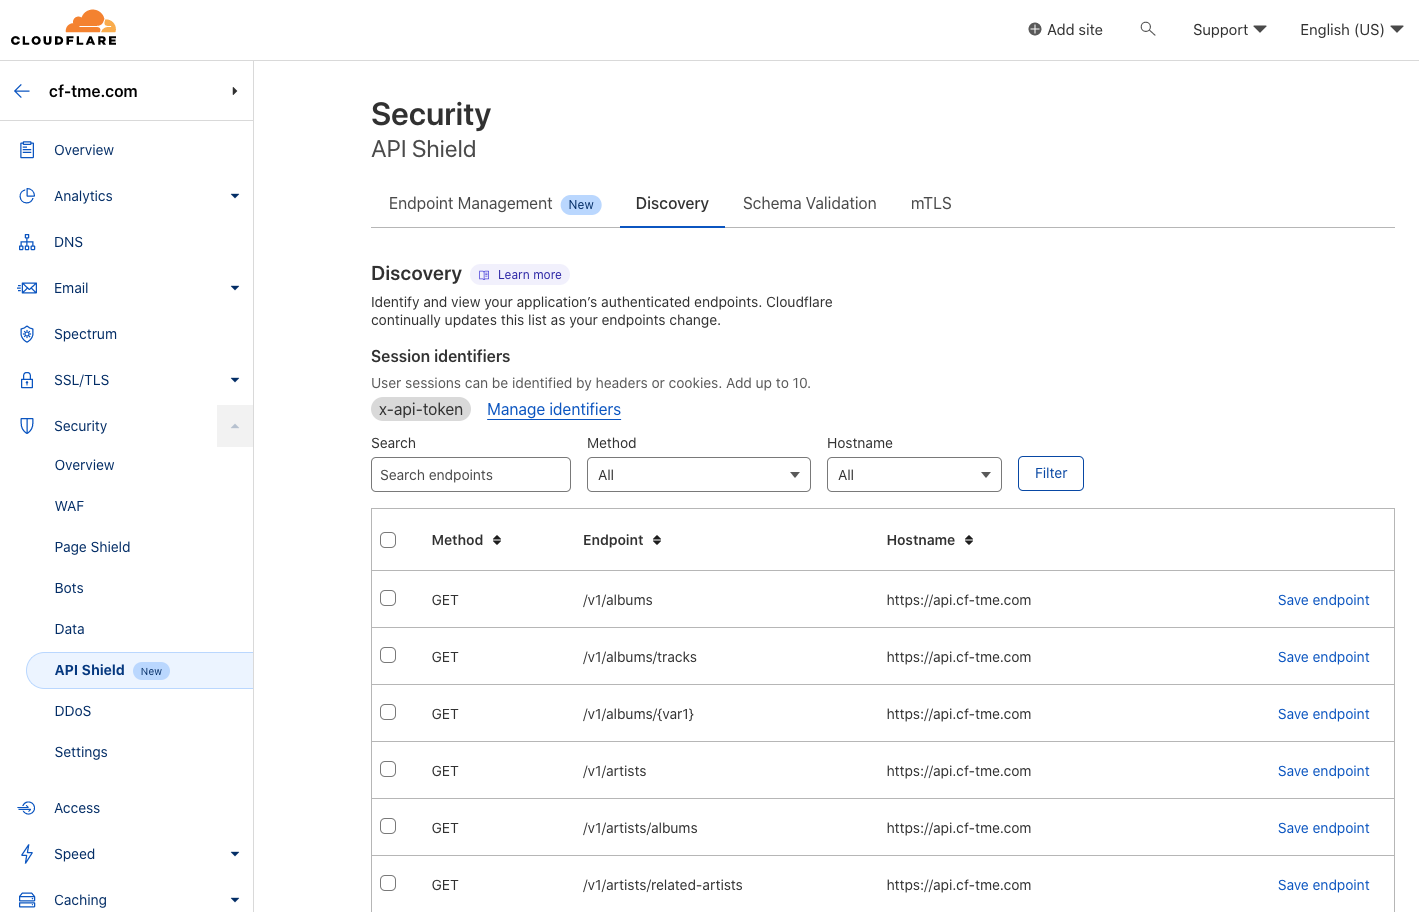
Cloudflare API Discovery
You can also see there is now an Endpoint Management tab under Security->API Shield. This is where all the saved endpoints can be viewed. Unlike the discovery tab, where endpoints will disappear if not seen being utilized for a certain period, under the Endpoint Management tab, endpoints will remain permanently unless manually deleted.
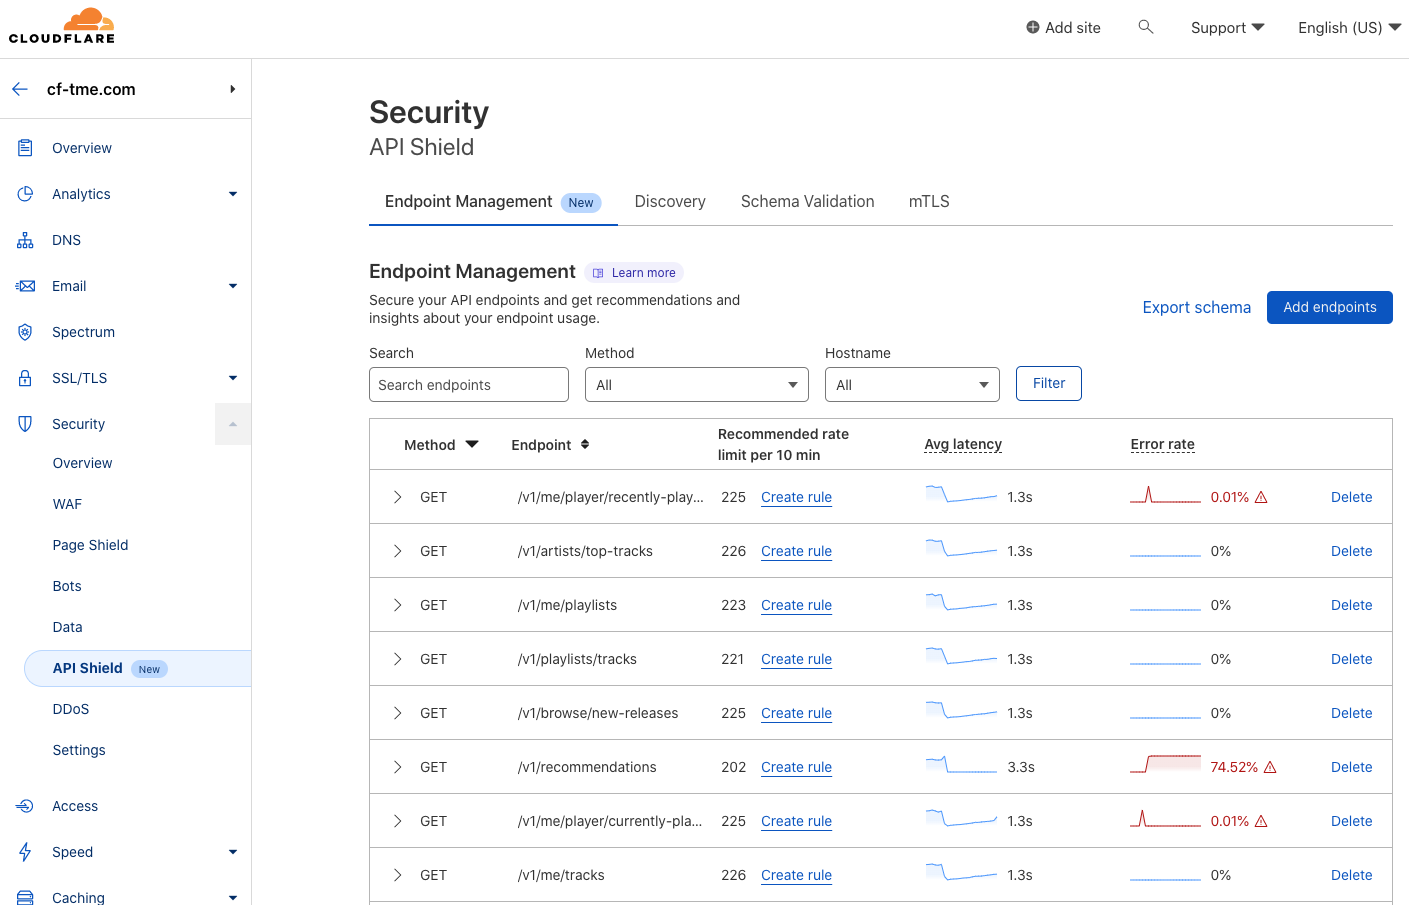
Cloudflare API Endpoint Management
When adding an API endpoint as shown below users can add an endpoint from the Cloudflare dynamically discovered APIs or manually add it by selecting the Manually add tab.
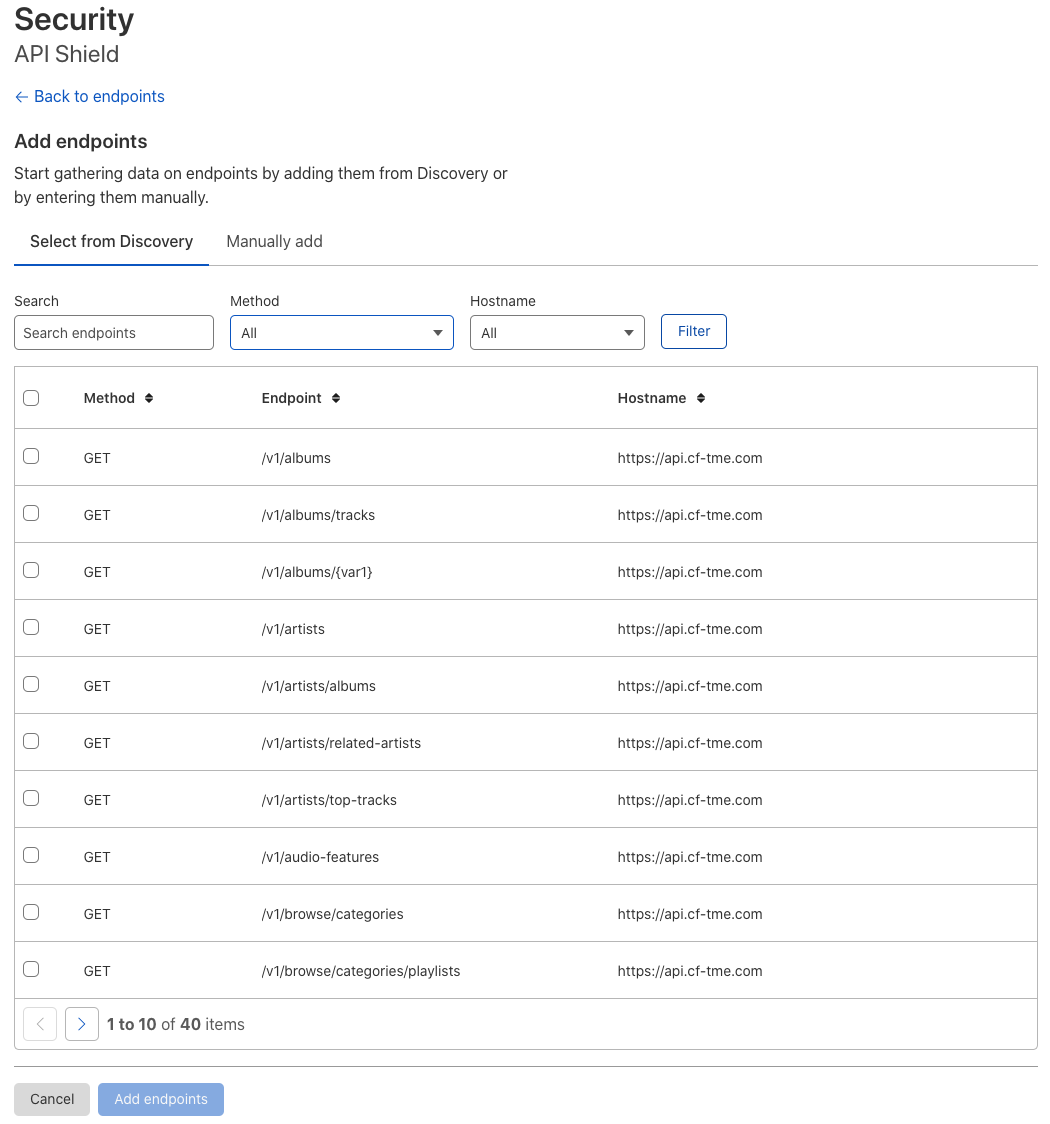
Cloudflare API Endpoint Management – Adding an API Endpoint
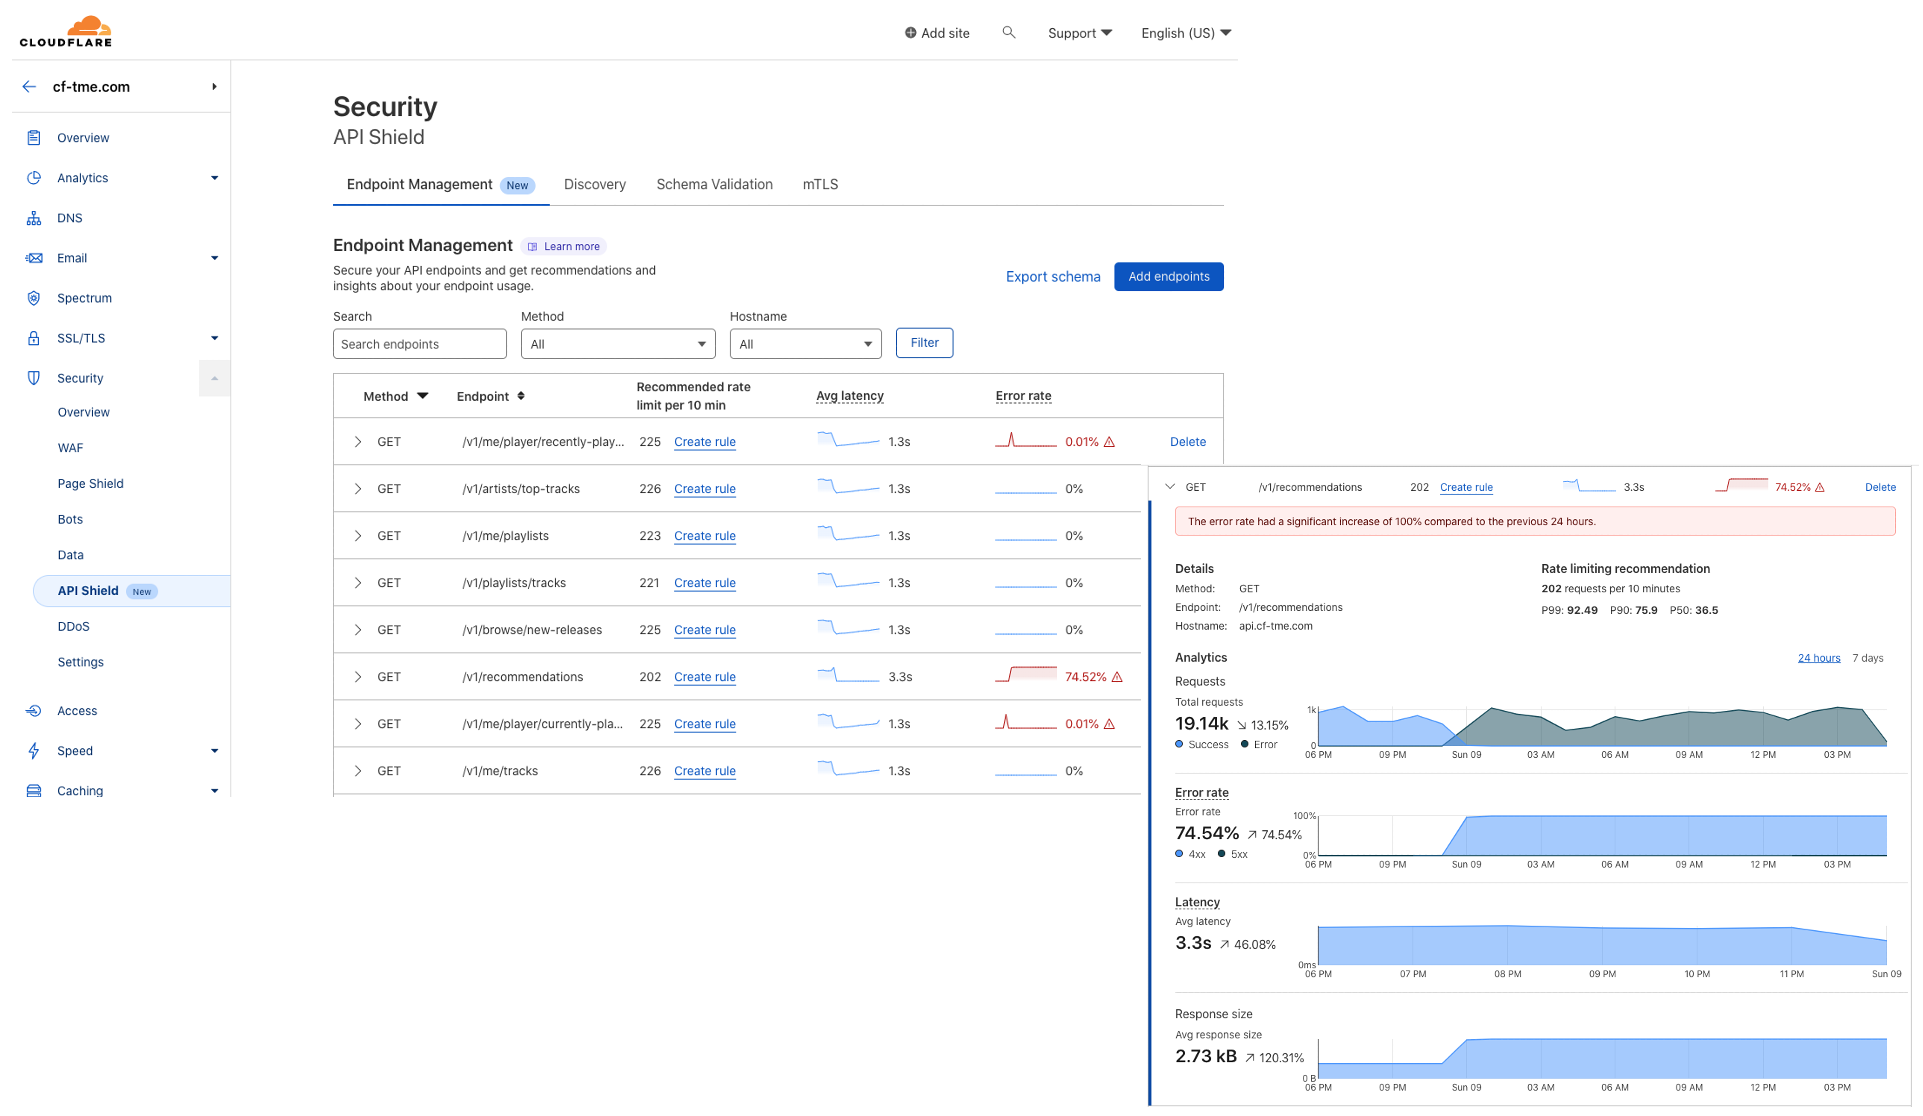
Once API endpoints are added, Cloudflare starts collecting data to build baselines for rate limiting recommendations and performance/error analytics. Not only can users see the # of requests, error rates and error types, latency, request response size, but they also get rate limiting recommendations, anomaly alerts when patterns deviate from baselines, and can compare API endpoint performance to past 24 hrs and 7 days. Currently anomaly alerts are shown for error rate and latency. Also by taking a quick look at the analytics, users can get a quick feel for the direction of changes – increases vs decreases, and the respective timeframe of the changes.
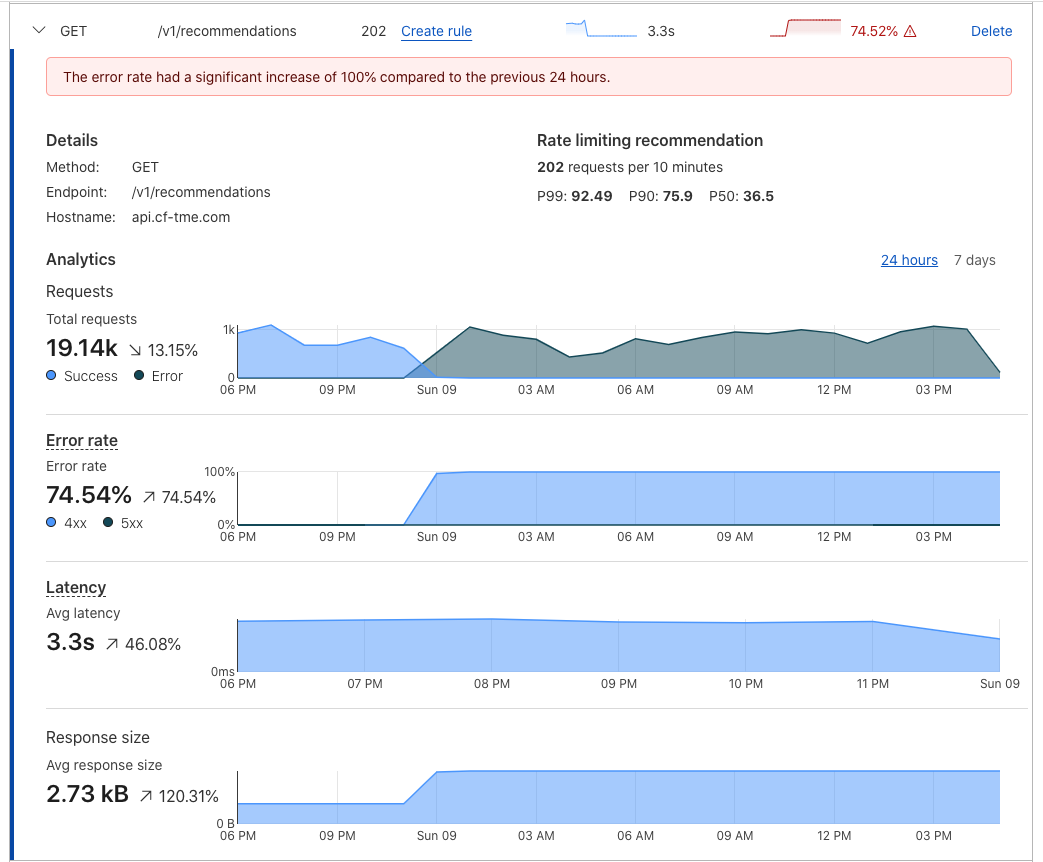
Cloudflare API Endpoint Metrics
Finally, as additional endpoints or dynamically or manually added, users can now easily export an OpenAPI schema.
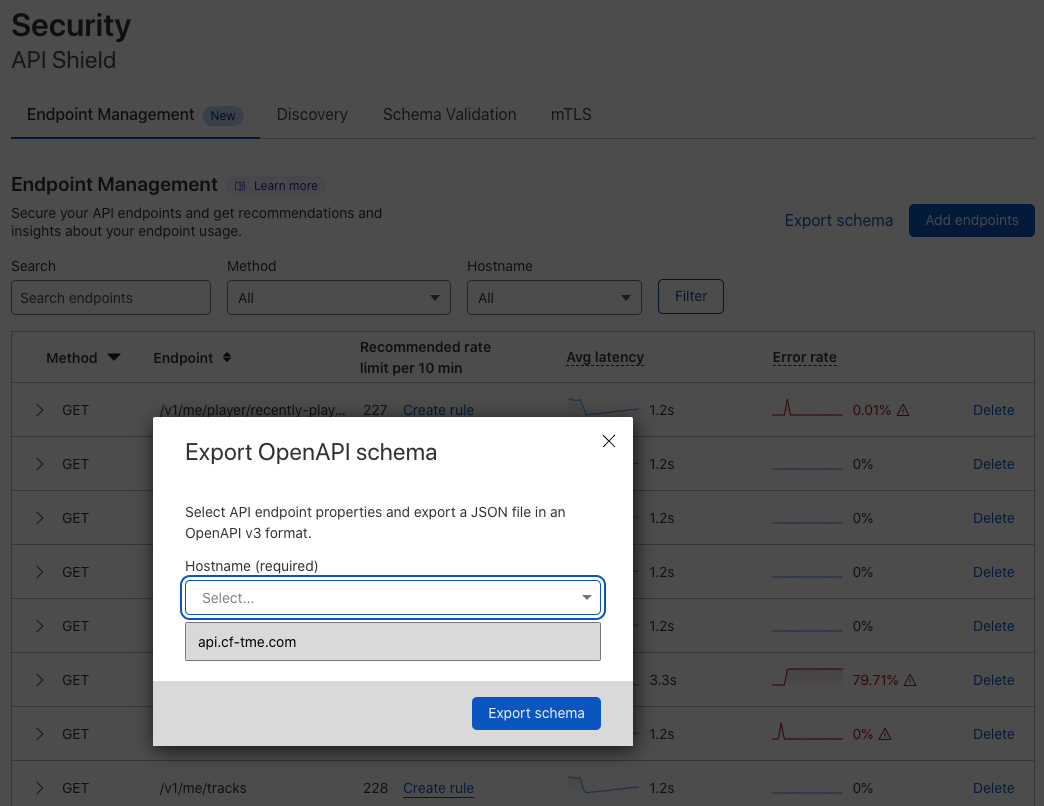
Cloudflare API Endpoint OpenAPI Schema Export
You can read more about the new Cloudflare API Shield capabilities and the transition to a full API Gateway here.
My blogs on HumairAhmed.com.
Follow me on Twitter.


 Twitter
 LinkedIn
 Youtube
 RSS
RSS
Pingback: Cloudflare API Gateway Demo and Walkthrough [Video] | HumairAhmed.com